One source of confusion I find myself clearing up a lot is the use of evaluating extension methods in the debugger windows. Users report evaluation as working sometimes but not others for the exact same piece of code. Such flaky behavior can only be the result of a poorly implemented feature or subtle user error. Right’
Unfortunately no. In this case the behavior described is very possible and ‘By Design’1. It’s an unfortunate fallout from how the way the debugger works.
Quick review. Expression evaluators strive to have evaluation parity with the compiler. So if expression expr _is valid at the place the debugger is stopped, _expr should also be a valid expression in the immediate, watch, etc … windows. This holds true for extension methods. For example
using System;
using System.Collections.Generic;
using System.Linq;
using System.Diagnostics;

namespace ConsoleApplication1 {
    class ExtensionMethodExample {
        public static void Example() {
            var col = new List<int>();
            col.Add(42);
            Debugger.Break();
        }
    }
}
At the Debugger.Break line expressions like col.First() are valid and legal (assuming System.Core is referenced). Hence they should also be available in the debugger windows. But with extension methods developers will occasionally see the following.

Clearly it failed to evaluate but is legal in code so users often interpret this as a bug (and I can’t blame them, the behavior is odd).
Expression evaluators host the compiler in order to evaluate expressions. In order to semantically interpret an expression compilers need symbols to bind to. In a debugging session symbols are acquired by reading the metadata from the DLLs loaded into the debugee process. So the evaluation essentially occurs by referencing the set of DLL’s loaded into the debugee process.
For most expressions this poses no problem. In order to even have a given value to run an expression off of it’s DLL must be loaded and hence symbols for the type of the value and it’s members are available. Extension methods are quite different though in that the target method can, and often does, live in a separate DLL. So unlike normal members, simply having a value in the debugger does not necessitate symbols for it’s extension method are loaded into the process. When they are not binding fails.
This is the case for the above sample. The symbols for the value ‘col’ are in mscorlib while the ‘First’ extension method are in System.Core.dll. If System.Core.dll is not loaded into the process then it’s symbols are not available and attempts to bind to the LINQ extension methods will fail.
This is what makes the behavior appear to be flaky. The ability to call an extension method is directly related to whether or not it’s DLL is currently loaded in the debugee process.’? When there is a disconnect between DLL’s available at compile time and loaded in the process there becomes a gap in what can be evaluated.’? DLL’s are loaded on demand and if no extension method, or other type, in the DLL has been used up until the current point in the process it will not be loaded and hence not available.
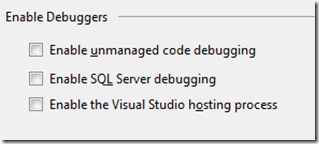
What complicates this discussion even further is a side effect of the hosting process in Visual Studio is that it hides this problem for certain DLLs (primarily System.Core). One of the features of the hosting process is that it preloads a set of DLL’s into the debugee process including System.Core.dll. As a result LINQ extension methods are readily available in most projects. For a normal console application the above won’t ever fail with F5 unless you specifically disable the hosting process in the debug tab of the project properties page.

This further adds to the perception of extension methods in the debugger are flaky since LINQ works but user defined extension methods fail. It creates additional confusion because the hosting process does not work for all project types (devices, certain types of web projects, etc ‘) and does not come into play in an attach scenarios.
failing but such is life.
-
I do hate using the ‘By Design’ tag to describe a feature as successfully ↩